
History graphs
Every sensor, number, status, person and switch has a history card: tap a sensor, hold a switch.
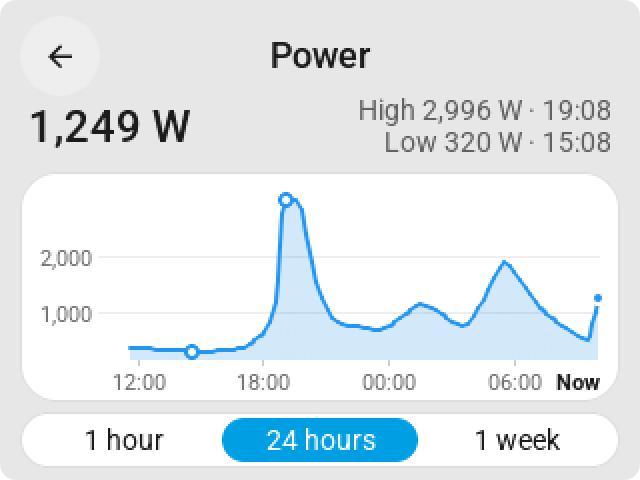
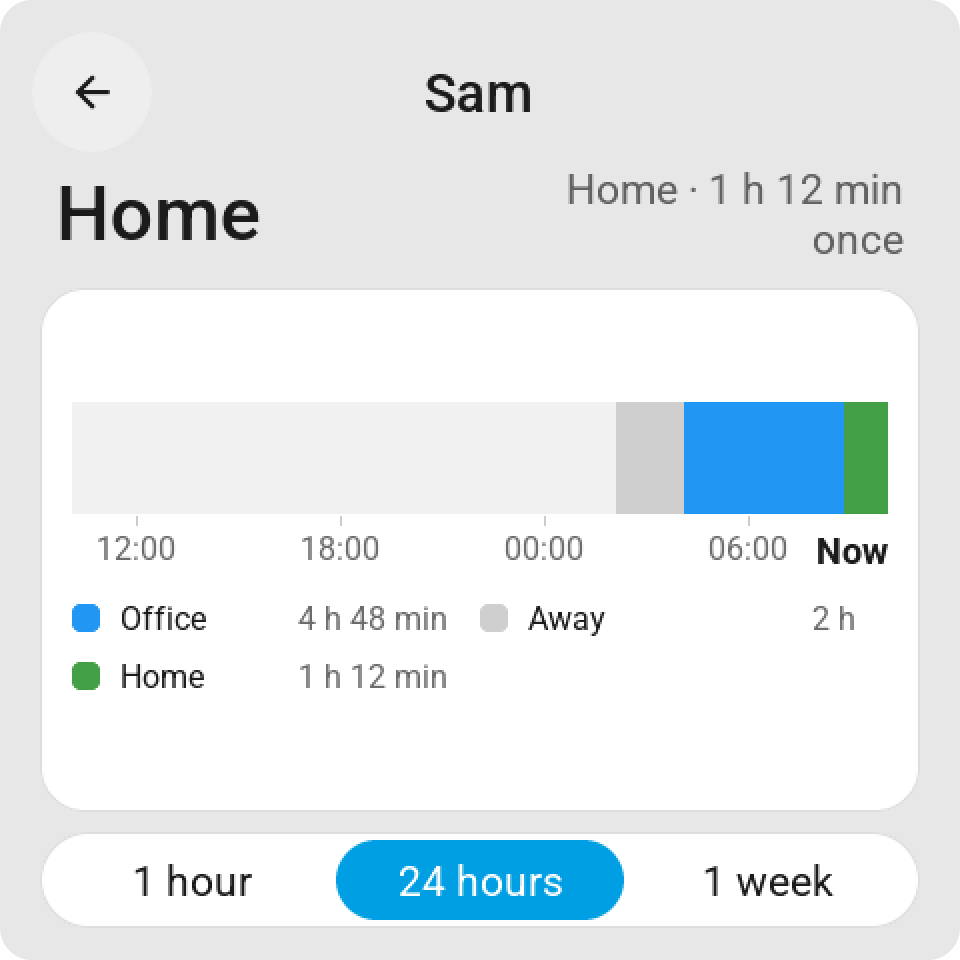
The card
1 hour, 24 hours or 1 week, with keys at the bottom. A card opens on 24 hours, or on 1 hour when the tile's own graph shows the hour.
A number draws a line through 24 averages, with an axis in round steps and the times under it. The value now stands at the top, with High and Low and when they happened.
A state draws a timeline: on and off, home and away, open and closed, with how long it was in each and how often it changed.
Put a finger on the graph and the top of the card shows the value or the state at that moment, until you lift it.
Where the numbers come from
The screen asks the app for the history when a card opens, and the app reads it from Home Assistant's recorder. A sensor without recorded numbers shows an empty line and says so. The history card works on every screen, the CYD included.
On the tile
A sensor's Graph display puts a small graph on the tile itself, over 1, 6 or 24 hours; see Sensors and values.